Evaluation of Thermal Pattern Distributions in Racehorse Saddles Using Infrared Thermography
Published by
Digatherm
on
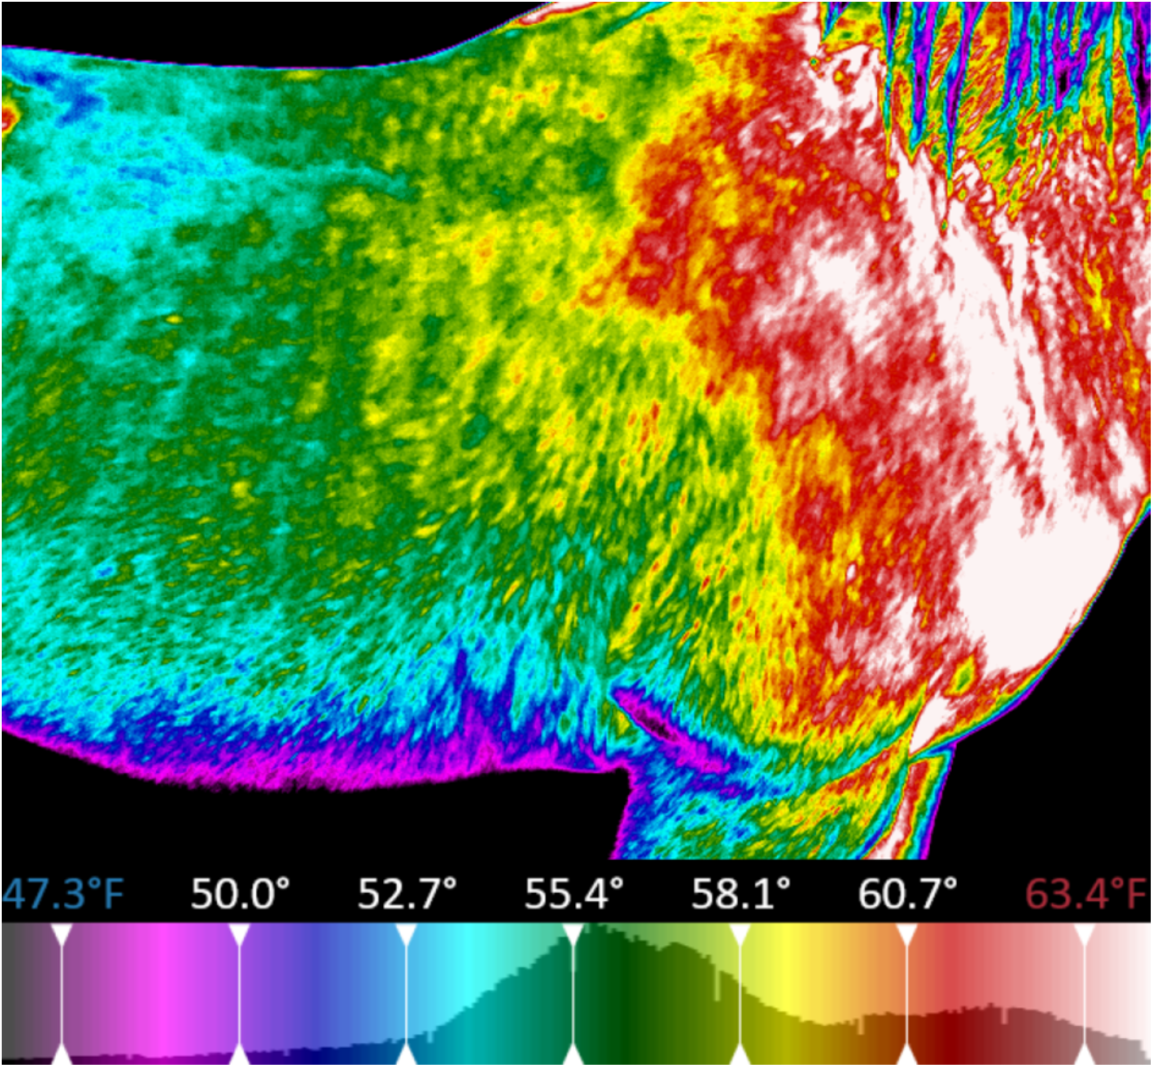
Abstract: The impact of a rider’s and saddle’s mass on saddle thermal pattern distribution was evaluated using infrared thermography (IRT). Eighteen racehorses were ridden by four riders with their own saddle. Images of the saddle panels were captured at each of six thermographic examinations. On each image, six regions of interest (ROIs) were marked on the saddle panels. The mean temperature for each ROI was extracted.
To evaluate the influence of load on saddle fit, 4 indicators were used: ΔTmax (difference between the mean temperature of the warmest and coolest ROI); standard deviation of the mean temperature of the six ROIs; right/left; bridging/rocking and front/back thermal pattern indicator. Incorrect saddle fit was found in 25 measurements (23.1%) with ΔTmax greater than 2˚C.
The relationships between rider and saddle fit as well as saddle fit and horse were significant (p<0.001). An average ΔTmax in rider A was significantly higher than in other riders (p<0.001). The right/left thermal pattern differed significantly from the optimal value for riders A and B; while the bridging/rocking thermal pattern differed significantly from this value for riders A, C and D (p<0.05). Front saddle thermal pattern was most frequent for rider A (41.5%), whereas back saddle thermal pattern was most frequent for rider C (85.7%).
Measurement of the mean temperature in 6 ROIs on saddle panels after training was helpful in assessing the influence of rider and saddle mass on saddle fit. IRT offered a non-invasive, rapid and simple method for assessing load on thermal pattern distribution in race saddles.
Reference: Soroko, M., Zaborski, D., Dudek, K., Yarnell, K., Górniak, W., & Vardasca, R. (2019). Evaluation of thermal pattern distributions in racehorse saddles using infrared thermography. PloS one, 14(8), e0221622.
|
Interested in learning more about thermal imaging? Request a demonstration with Digatherm and discover how veterinary thermography can help you find problem areas faster and easily monitor treatment progress. |